Total Transborder Freight by Border in May 2023, Compared to May 2022
Transborder freight between the U.S. and North American countries Canada and Mexico:
- Total transborder freight: $136.2 billion of transborder freight moved by all modes of transportation, down 2.3% compared to May 2022
- Freight between the U.S. and Canada totaled $67.6 billion, down 4.8% from May 2022
- Freight between the U.S. and Mexico totaled $68.7 billion, up 0.3% from May 2022
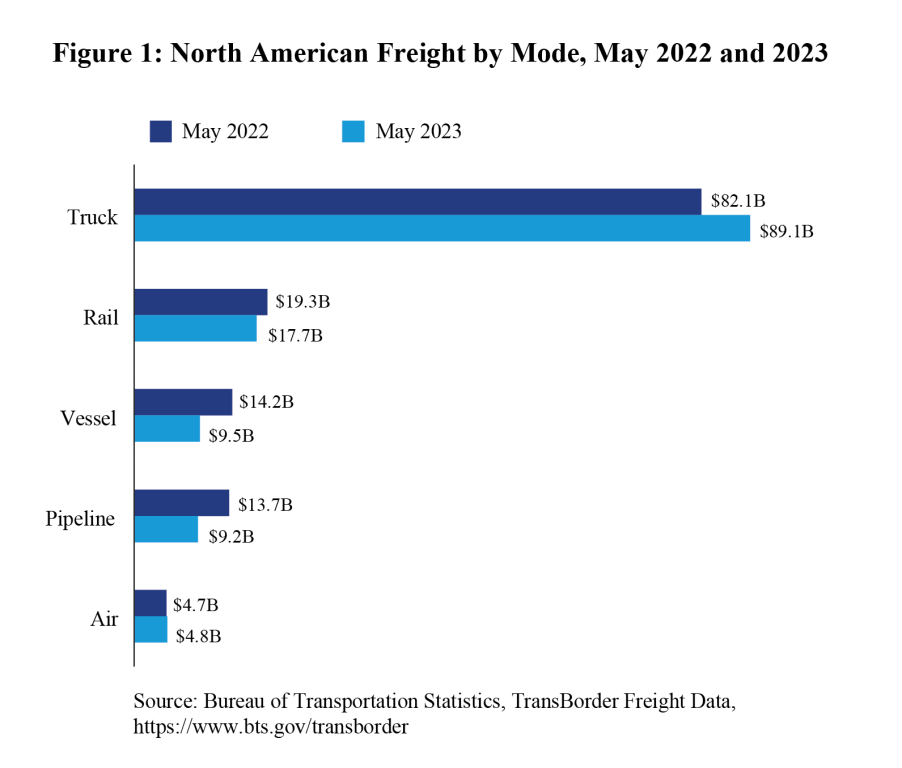
- Trucks moved $89.1 billion of freight, up 8.6% compared to May 2022
- Railways moved $17.7 billion of freight, down 8.0% compared to May 2022
- Vessels moved $9.5 billion of freight, down 32.8% compared to May 2022
- Pipelines moved $9.2 billion of freight, down 32.9% compared to May 2022
- Air moved $4.8 billion of freight, up 2.6% compared to May 2022
Read AJOT's reporting on USMCA Trade from AJOT in the July 2023 Issue
Total Transborder Freight by Border and Mode
U.S.-Canada (both directions)
(Dollars in Billions)
- Truck: $39.5
- Rail: $9.5
- Pipeline: $8.6
- Vessel: $3.0
- Air: $2.9
U.S.-Mexico (both directions)
(Dollars in Billions)
- Truck: $49.6
- Rail: $8.2
- Vessel: $6.5
- Air: $1.9
- Pipeline: $0.6
Detroit, Port Huron, and Buffalo are the top truck ports for U.S. freight flows with Canada, while Laredo, El Paso, and Otay Mesa are the top truck ports with Mexico. Detroit, Port Huron, and International Falls are the top rail connection ports for U.S. freight flows with Canada, while Laredo, Eagle Pass, and El Paso are the top rail connection ports with Mexico. Chicago, Port Huron, and Minneapolis are the top pipeline connection regions for U.S. energy freight flows with Canada. El Paso, Hidalgo, and Laredo are the top pipeline connection regions with Mexico. Port of Boston, Arthur, and Portland are the top water port connections for U.S. energy flows with Canada. Port of Houston, Arthur, and Texas City are the top water port connections for U.S. energy flows on the Southern border.
U.S.-Canada Trade Breakdown
Top three truck ports
- Detroit, MI $10.8 billion
- Port Huron, MI $7.0 billion
- Buffalo, NY $6.5 billion
Top three truck commodities
- Computers/parts $6.4 billion
- Vehicles/parts $6.1 billion
- Electrical machinery $2.5 billion
Top three rail ports
- Port Huron, MI $2.8 billion
- Detroit, MI $2.3 billion
- Int’l Falls, MN $1.2 billion
Top three rail commodities
- Vehicles/part $3.7 billion
- Mineral fuel $0.7 billion
- Plastics $0.5 billion
U.S.-Mexico Trade Breakdown
Top three truck ports
- Laredo, TX $22.8 billion
- El Paso-Ysleta, TX $6.7 billion
- Otay Mesa, CA $5.3 billion
Top three truck commodities
- Electrical machinery $10.8 billion
- Computers/parts $9.8 billion
- Vehicles/parts $7.5 billion
Top three rail ports
- Laredo, TX $4.3 billion
- Eagle Pass, TX $2.3 billion
- Nogales, AZ $0.6 billion
Top three rail commodities
- Vehicles/parts $4.1 billion
- Computers/part $0.7 billion
- Cereals $0.5 billion