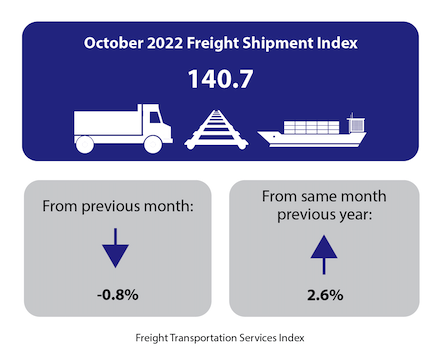
The Freight Transportation Services Index (TSI), which is based on the amount of freight carried by the for-hire transportation industry, fell 0.8% in October from September, falling for the first month after two months of growth, according to the U.S. Department of Transportation’s Bureau of Transportation Statistics’ (BTS). From October 2021 to October 2022 the index rose 2.6%.
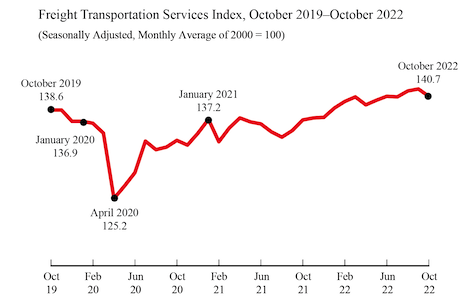
The level of for-hire freight shipments in October measured by the Freight TSI (140.7) was one percent below the all-time high level of 142.1 in August 2019 (Table 2A). BTS’ TSI records begin in 2000. See historical TSI data.
The September index was revised to 141.8 from 142.0 in last month's release.
BTS is withholding the scheduled release of the passenger and combined indexes for October. The passenger index for October is a statistical estimate of airline passenger travel and other components based on historical trends up to September 2022. The statistical estimate does not fully account for the rapidly changing impacts of the coronavirus on the historical trend. Air freight and waterborne for October are also statistical estimates. Since air freight and waterborne makes up a smaller part of the freight index, the freight TSI is being released as scheduled with the air freight estimate included. The September passenger and combined indexes are available on the BTS website.
The Freight TSI measures the month-to-month changes in for-hire freight shipments by mode of transportation in tons and ton-miles, which are combined into one index. The index measures the output of the for-hire freight transportation industry and consists of data from for-hire trucking, rail, inland waterways, pipelines and air freight. The TSI is seasonally-adjusted to remove regular seasonal movement, which enables month-to-month comparisons.
Analysis: The Freight TSI decreased in October due to seasonally adjusted decreases in trucking, water, and pipeline, while air freight, rail intermodal, and rail carload grew.
The October decrease came in the context of mixed results for several other indicators. The Federal Reserve Board Industrial Production (IP) Index declined by 0.1% in October, reflecting decreases of 0.4% in mining and 1.5% in utilities, while manufacturing grew by 0.1%. Housing starts were down 4.2% while personal income increased by 0.7%.
The Institute for Supply Management Manufacturing (ISM) index was down 0.7 points to 50.2, indicating slowing growth in manufacturing.
Although the October Passenger TSI is being withheld because of the previously cited difficulty of estimating airline passenger travel and other components, the September index is now being released. The index increased 4.3% from August to September. Seasonally adjusted air passenger, transit, and rail passenger all increased.
The Passenger TSI has now exceeded its level in March 2020 —the first month of the pandemic— for sixteen months in a row but remains below its pre-pandemic level (February 2020) for the 31st consecutive month.
Trend: The October freight index decrease was the third decrease in seven months for a total increase of 0.1% since March. It was the fourth month-over-month decrease in fourteen months, for a total increase of 4.6% since August 2021. The October Freight TSI is 12.4% above the pandemic low in April 2020; it has increased in 20 of the 30 months since that low. The index is now 1.0% below its previous record level of 142.1 set in August 2019, despite increasing in 20 of the 38 months since that earlier peak.
Index highs and lows: For-hire freight shipments in October 2022 (140.7) were 48.1% higher than the low in April 2009 during the recession (95.0). The October 2022 level was one percent below the historic peak reached in August 2019 (142.1) (Table 1A).
Year to date: For-hire freight shipments measured by the index were up 2.3% in October compared to the end of 2021 (Table 3).
Long-term trend: For-hire freight shipments are up 8.0% in the five years from October 2017 and are up 27.3% in the 10 years from October 2012 (Table 5).
Same month of previous year: October 2022 for-hire freight shipments were up 2.6% from October 2021 (Tables 4, 5).
The TSI has three seasonally-adjusted indexes that measure changes from the monthly average of the base year of 2000. The three indexes are freight shipments, passenger travel and a combined measure that merges the freight and passenger indexes. See Seasonally-Adjusted Transportation Data for numbers for individual modes. TSI includes data from 2000 to the present. Release of the November 2022 index is scheduled for January 12.
Revisions: Monthly data has changed from previous releases due to the use of concurrent seasonal analysis, which results in seasonal analysis factors changing as each month’s data are added.
BTS research has shown a clear relationship between economic cycles and the Freight and Passenger Transportation Services Indexes. See a study of this relationship using smoothed and detrended TSI data. Researchers who wish to compare TSI over time with other economic indicators, can use the FRED database, which includes freight, passenger and combined TSI, and which makes it possible to easily graph TSI alongside the other series in that database. See TSI data on FRED.
For charts and discussion on the relationship of the TSI to the economy, see Transportation as an Economic Indicator: Transportation Services Index.
Table A: Summary of Revisions to Freight TSI in Previous 12 MonthsFreight TSI | |||
Current release | Previous month's release | Percent change | |
Oct-21 | 137.1 | 136.7 | 0.29 |
Nov-21 | 137.4 | 137.4 | 0.00 |
Dec-21 | 137.5 | 137.5 | 0.00 |
Jan-22 | 138.9 | 139.1 | -0.14 |
Feb-22 | 139.9 | 139.9 | 0.00 |
Mar-22 | 140.6 | 140.6 | 0.00 |
Apr-22 | 139.4 | 139.4 | 0.00 |
May-22 | 140.1 | 140.1 | 0.00 |
Jun-22 | 140.7 | 140.8 | -0.07 |
Jul-22 | 140.6 | 140.6 | 0.00 |
Aug-22 | 141.5 | 141.6 | -0.07 |
Sep-22 | 141.8 | 142.0 | -0.14 |
SOURCE: Bureau of Transportation Statistics.
Table 1: Freight Transportation Services Index since April 2022 Percent Change from Previous Month(Seasonally Adjusted, Monthly Average of 2000 = 100)Freight | ||
Index | Percent change | |
April | 139.4 | -0.9 |
May | 140.1 | 0.5 |
June | 140.7 | 0.4 |
July | 140.6 | -0.1 |
August | 141.5 | 0.6 |
September | 141.8 | 0.2 |
October | 140.7 | -0.8 |
SOURCE: Bureau of Transportation Statistics.
Table 1A: Annual High and Low Points in Freight Transportation Services Index, 2009-2022Year | Month of peak | Value at peak | Month of low | Value at low |
2009 | December | 101.9 | April | 95.0 |
2018 | November | 139.8 | January | 131.8 |
2019 | August | 142.1 | December | 136.9 |
2020 | January | 136.9 | April | 125.2 |
2021 | December | 137.5 | February | 133.8 |
2022 (thru October) | September | 141.8 | January | 138.9 |
SOURCE: Bureau of Transportation Statistics.
Table 2: Freight Transportation Services Index Monthly Changes, 2019-2022Percent change from previous month2019 | 2020 | 2021 | 2022 | |
Percent change | Percent change | Percent change | Percent change | |
January | 0.8 | 0.0 | 1.6 | 1.0 |
February | -0.6 | -0.2 | -2.5 | 0.7 |
March | 0.1 | -1.1 | 1.6 | 0.5 |
April | 0.6 | -7.3 | 1.1 | -0.9 |
May | 0.3 | 1.5 | -0.4 | 0.5 |
June | -0.3 | 1.6 | -0.2 | 0.4 |
July | 0.9 | 3.7 | -0.9 | -0.1 |
August | 1.4 | -1.0 | -0.6 | 0.6 |
September | -2.4 | 0.3 | 0.7 | 0.2 |
October | -0.1 | 0.8 | 1.2 | -0.8 |
November | 0.0 | -0.5 | 0.2 | |
December | -1.2 | 1.4 | 0.1 |
SOURCE: Bureau of Transportation Statistics.
Table 2A: Freight Transportation Services Index by Month, 2019-20222019 | 2020 | 2021 | 2022 | |
January | 138.8 | 136.9 | 137.2 | 138.9 |
February | 137.9 | 136.6 | 133.8 | 139.9 |
March | 138.1 | 135.1 | 135.9 | 140.6 |
April | 138.9 | 125.2 | 137.4 | 139.4 |
May | 139.3 | 127.1 | 136.8 | 140.1 |
June | 138.9 | 129.1 | 136.5 | 140.7 |
July | 140.2 | 133.9 | 135.3 | 140.6 |
August | 142.1 | 132.6 | 134.5 | 141.5 |
September | 138.7 | 133.0 | 135.5 | 141.8 |
October | 138.6 | 134.0 | 137.1 | 140.7 |
November | 138.6 | 133.3 | 137.4 | |
December | 136.9 | 135.1 | 137.5 |
SOURCE: Bureau of Transportation Statistics.
Table 3: Freight Transportation Services Index Year-to-Date Change, 2013-2022Percent change to October from December of the previous yearYear | Freight |
2013 | 3.8 |
2014 | 4.1 |
2015 | -0.2 |
2016 | 2.2 |
2017 | 4.4 |
2018 | 4.2 |
2019 | 0.7 |
2020 | -2.1 |
2021 | 1.5 |
2022 | 2.3 |