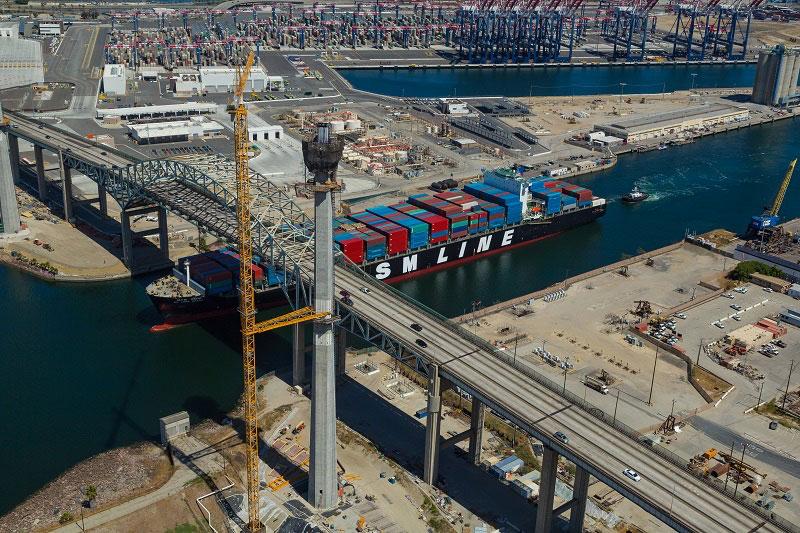
Cargo rises on economic gains, shipping alliance changesSM Long Beach passes under the Gerald Desmond Bridge during a maiden call on April 30, 2017.
SM Long Beach passes under the Gerald Desmond Bridge during a maiden call on April 30, 2017.New vessel-sharing alliances and increased use of terminals pushed the number of containers flowing through the Port of Long Beach in May to a record high for the month. A total of 648,287 twenty-foot equivalent units (TEUs) moved through the harbor in May, an increase of 1.2 percent compared to the same month a year ago. May 2016 volume was the second-highest May in the Port’s history behind May 2006.
Last month, Long Beach dockworkers handled 336,594 import containers, a 1.8 percent increase. Export containers were down 14.3 percent to 118,786 TEUs, while empties rose 12.6 percent to 192,908. Overall, it was the best month since September 2015.
“Last May was a great month, so we’re encouraged that we did even better this year,” said Port of Long Beach Executive Director Mario Cordero. “Our strong belief is that if we continue to build the most modern facilities of any port in the United States and provide the best service, the customers will come.”
The National Retail Federation has forecast steady growth in imports during the next few months as the peak season begins. For the calendar year to date, cargo traffic has risen 4.1 percent in Long Beach.
“The new alliances are making more efficient use of our terminals with their deployments,” said Harbor Commission President Lori Ann Guzmán. “Beyond that, the strong U.S. dollar is growing our imports, but not helping our exports. Still, we’re in line with our projections for the year, and the Port is in a strong position as we head into the peak season.”
The Port of Long Beach is one of the world’s premier seaports, a gateway for trans-Pacific trade and a trailblazer in goods movement and environmental stewardship. With 175 shipping lines connecting Long Beach to 217 seaports, the Port handles $180 billion in trade annually, supporting hundreds of thousands of Southern California jobs.
May
Fiscal Year to Date***
2017**
2016
%Change
2017***
2016
%Change
Loaded Inbound
336,594
330,639
1.8%
2,262,004
2,270,602
-0.4%
Loaded Outbound
118,786
138,594
-14.3%
964,123
987,501
-2.4%
Empties
192,908
171,333
12.6%
1,231,600
1,259,889
-2.2%
TOTAL (T.E.U.)
648,287
640,566
1.2%
4,457,726
4,517,992
-1.3%
*TEUs: 20-foot equivalent units or 20-foot-long cargo container**Preliminary estimate The size of cargo containers range from 20 feet long to more than 50 feet long. The international measure is the smallest box, the 20-footer or 20-foot-equivalent unit (TEU).*** Fiscal Year = Oct. 1 through Sep. 30.
More Ports & Terminals
Galveston Wharves board approves $29 million construction contract for cargo area
America’s ports will reduce air pollution with $150 million in FHWA grants
Today, the American Association of Port Authorities (AAPA), joined by several port leaders at a White House event, celebrated almost $150 million in grants from the Federal Highway Administration's (FHWA)…