The Drewry Container Port Throughput Indices are a series of volume growth/decline indices based on monthly throughput data for a sample of over 220 ports worldwide, representing over 75% of global volumes. The base point for the indices is January 2012 = 100.
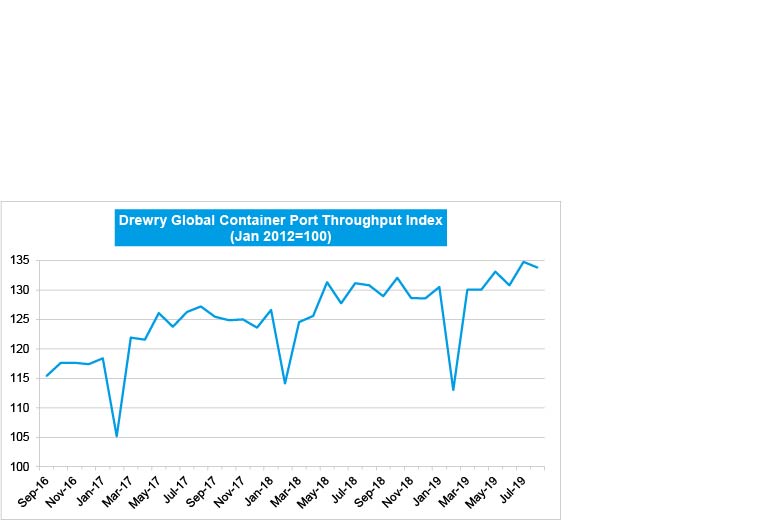
• In August 2019, the global container port throughput index declined to 133.8 points, after reaching an all-time high of 134.8 points in July 2019. A lull in August was seen last year too. However, the August 2019 figure was 3 points higher than in August 2018 (representing 2.3% growth) and nearly 11.8 points up on the August 2017 figure of 127 points.
• Africa registered the highest monthly growth of 7.4% (7.9 points) with the index touching 114.5 points which was the highest in the last 19 months. However, the index figures for Africa are based on a relatively small sample. We expected container throughput to increase in August, similar to the trend witnessed in the last few years.
• While China and Asia (excl. China) both saw annual growth of close to 2.0%, their month-on-month growth varied. For China it was slightly down by 0.4% whereas the drop was at a much higher 2.3% (3 points) for Asia (excl. China).
• The month-on-month index figures for Europe in August (traditional holiday period) showed the second largest decline of around 2.1% (2.7 points) after Asia (excl. China) which recorded a large decline of 2.3% (3.0 points).
• All world regions except Latin America experienced annual growth. The index for Latin America has gradually inched up and is now approaching an 11 month high.
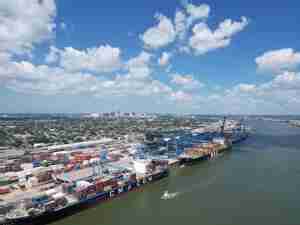
• North America achieved an increase of 1.4% (2.0 points) over July 2019 and 3.9% (5.6 points) over August 2018.