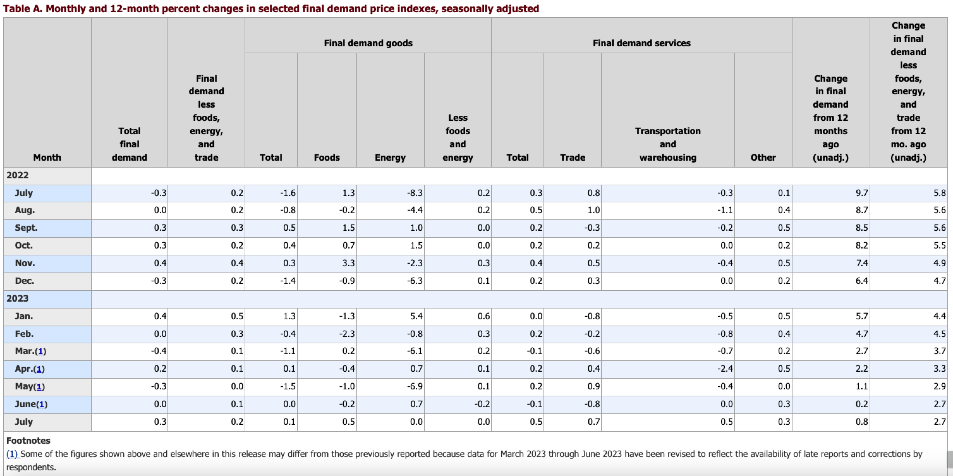
The Producer Price Index for final demand increased 0.3 percent in July, seasonally adjusted, the U.S. Bureau of Labor Statistics reported today. Final demand prices were unchanged in June and declined 0.3 percent in May. (See Table A.) On an unadjusted basis, the index for final demand advanced 0.8 percent for the 12 months ended in July.
In July, the increase in final demand prices was led by a 0.5-percent rise in the index for final demand services. Prices for final demand goods edged up 0.1 percent.
The index for final demand less foods, energy, and trade services moved up 0.2 percent in July, the largest increase since a 0.3 percent rise in February. For the 12 months that ended in July, prices for final demand for fewer foods, energy, and trade services advanced 2.7 percent.
Final Demand
Final demand services: The index for final demand services increased 0.5 percent in July, the largest rise since moving up 0.5 percent in August 2022. Leading the broad-based advance in July, prices for final demand services less trade, transportation, and warehousing climbed 0.3 percent.
Margins for final demand trade services rose 0.7 percent, and the index for final demand transportation and warehousing services moved up 0.5 percent. (Trade indexes measure changes in margins received by wholesalers and retailers.)
Product detail: Forty percent of the July advance in the index for final demand services can be traced to a 7.6 percent rise in prices for portfolio management. The indexes for machinery and vehicle wholesaling; outpatient care (partial); chemicals and allied products wholesaling; securities brokerage, dealing, investment advice, and related services; and transportation of passengers (partial) also moved higher. Conversely, margins for food and alcohol retailing declined 2.5 percent. The indexes for application software publishing and for long-distance motor carrying also fell. (See Table 2.)
Final demand goods: Prices for final demand goods edged up 0.1 percent in July after no change in June. The July increase is attributable to the index for final-demand foods, which rose 0.5 percent.
Prices for final demand goods less foods and energy and for final demand energy were both unchanged.
Product detail: Within the index for final demand goods in July, prices for meats rose 5.0 percent.
The indexes for gas fuels; hay, hayseeds, oilseeds; utility natural gas; and motor vehicles also moved higher. In contrast, prices for diesel fuel dropped 7.1 percent. The indexes for gasoline, fresh fruits and melons, and plastic resins and materials also decreased.
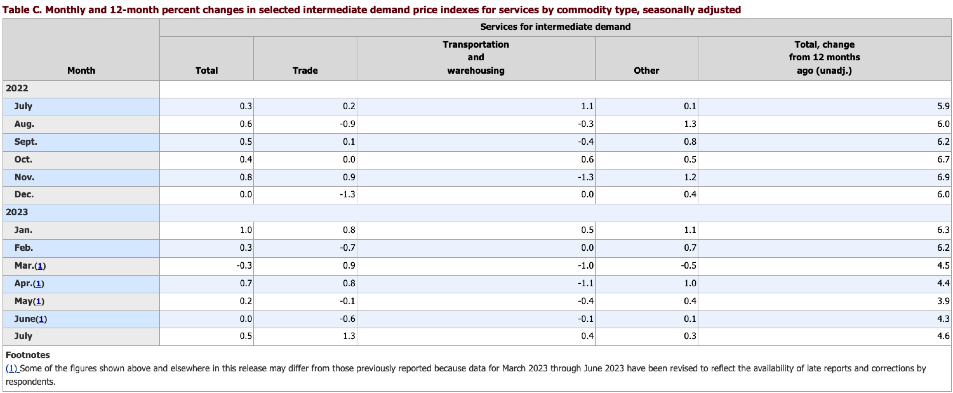
Services for intermediate demand: The index for services for intermediate demand increased 0.5 percent in July after no change in June. Half of the broad-based rise can be traced to margins for trade services for intermediate demand, which moved up 1.3 percent. The indexes for services less trade, transportation, and warehousing for intermediate demand and for transportation and warehousing services for intermediate demand also advanced, climbing 0.3 percent and 0.4 percent, respectively. For the 12 months that ended in July, prices for services for intermediate demand rose 4.6 percent, the largest 12-month increase since moving up 6.2 percent in February.
Product detail: Within the index for services for intermediate demand in July, margins for chemicals and allied products wholesaling advanced by 2.4 percent. The indexes for portfolio management; securities brokerage, dealing, investment advice, and related services; courier, messenger, and U.S. postal services; accounting services (partial); and hardware, building material, and supplies retailing also moved higher. Conversely, prices for business loans (partial) decreased by 1.5 percent. The indexes for fuels and lubricants retailing and for the arrangement of freight and cargo transportation also fell.
Intermediate Demand by Production Flow
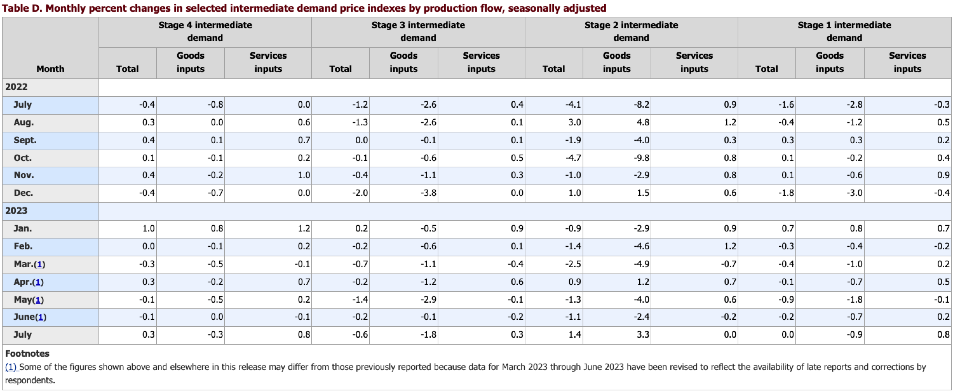
Stage 4 intermediate demand: Prices for stage 4 intermediate demand rose 0.3 percent in July after declining 0.1 percent in June. In July, the index for total services inputs to stage 4 intermediate demand increased by 0.8 percent. In contrast, prices for total goods inputs moved down 0.3 percent.
(See Table D.) Advances in the indexes for portfolio management; securities brokerage, dealing, investment advice, and related services; meats; nonresidential property management fees; machinery and equipment parts and supplies wholesaling; and courier, messenger, and U.S. postal services outweighed falling prices for steel mill products, gross rents for retail properties, and corn. For the 12 months that ended in July, the index for stage 4 intermediate demand rose 2.0 percent.
Stage 3 intermediate demand: Prices for stage 3 intermediate demand moved down 0.6 percent in July, the sixth consecutive decrease. In July, the index for total goods inputs to stage 3 intermediate demand declined by 1.8 percent. Conversely, prices for total services inputs advanced by 0.3 percent. Lower prices for steel mill products, corn, slaughter poultry, diesel fuel, plastic resins, and materials, and business loans (partial) outweighed increases in the indexes for courier, messenger, and U.S. postal services; slaughter hogs; and slaughter cattle. For the 12 months that ended in July, prices for stage 3 intermediate demand fell 6.9 percent.
Stage 2 intermediate demand: The index for stage 2 intermediate demand increased 1.4 percent in July, the largest advance since rising 3.0 percent in August 2022. In July, prices for total goods inputs to stage 2 intermediate demand moved up 3.3 percent, while the index for total services inputs was unchanged. Advancing prices for crude petroleum, gas fuels, oilseeds, prepared animal feeds, portfolio management, and accounting services (partial) outweighed decreases in the indexes for business loans (partial), fuels and lubricants retailing, and industrial chemicals. For the 12 months that ended in July, prices for stage 2 intermediate demand declined 8.5 percent.
Stage 1 intermediate demand: The index for stage 1 intermediate demand was unchanged in July after moving down 0.2 percent in June. In July, a 0.8-percent advance in prices for total services inputs to stage 1 intermediate demand offset a 0.9-percent decrease in the index for total goods inputs. Increases in the indexes for portfolio management; securities brokerage, dealing, investment advice, and related services; hardware, building material, and supplies retailing; courier, messenger, and U.S. postal services; and natural gas to electric utilities offset declines in prices for steel mill products, diesel fuel, corn, gross rents for retail properties, and industrial chemicals. For the 12 months that ended in July, prices for stage 1 intermediate demand fell 3.1 percent.