The U.S. Census Bureau and the U.S. Bureau of Economic Analysis announced today that the goods and services deficit was $67.4 billion in January, up $3.3 billion from $64.2 billion in December, revised.
Exports, Imports, and Balance (exhibit 1)
January exports were $257.2 billion, $0.3 billion more than December exports. January imports were $324.6 billion, $3.6 billion more than December imports.
The January increase in the goods and services deficit reflected an increase in the goods deficit of $3.0 billion to $91.6 billion and a decrease in the services surplus of $0.3 billion to $24.2 billion.
Year-over-year, the goods and services deficit decreased $2.9 billion, or 4.1 percent, from January 2023. Exports decreased $1.0 billion or 0.4 percent. Imports decreased $3.9 billion or 1.2 percent.
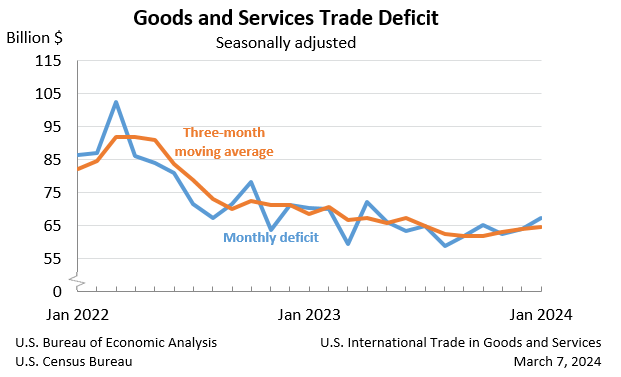
Three-Month Moving Averages (exhibit 2)
The average goods and services deficit increased $0.7 billion to $64.8 billion for the three months ending in January.
- Average exports decreased $0.2 billion to $256.0 billion in January.
- Average imports increased $0.5 billion to $320.8 billion in January.
Year-over-year, the average goods and services deficit decreased $3.7 billion from the three months ending in January 2023.
- Average exports increased $2.3 billion from January 2023.
- Average imports decreased $1.5 billion from January 2023.
Exports (exhibits 3, 6, and 7)
Exports of goods increased $0.2 billion to $171.8 billion in January.
Exports of goods on a Census basis increased $0.2 billion.
- Automotive vehicles, parts, and engines increased $1.4 billion.
- Passenger cars increased $0.7 billion.
- Other automotive parts and accessories increased $0.5 billion.
- Consumer goods increased $0.6 billion.
- Capital goods increased $0.6 billion.
- Industrial supplies and materials decreased $1.7 billion.
- Crude oil decreased $1.4 billion.
- Fuel oil decreased $0.6 billion.
- Nonmonetary gold increased $1.0 billion.
Net balance of payments adjustments decreased $0.1 billion.
Exports of services increased $0.2 billion to $85.4 billion in January.
- Financial services increased $0.1 billion.
- Travel increased $0.1 billion.
Imports (exhibits 4, 6, and 8)
Imports of goods increased $3.1 billion to $263.4 billion in January.
Imports of goods on a Census basis increased $3.0 billion.
- Capital goods increased $3.1 billion.
- Computer accessories increased $0.8 billion.
- Computers increased $0.6 billion.
- Semiconductors increased $0.6 billion.
- Automotive vehicles, parts, and engines increased $2.0 billion.
- Passenger cars increased $1.1 billion.
- Trucks, buses, and special purpose vehicles increased $1.0 billion.
- Industrial supplies and materials decreased $1.3 billion.
- Crude oil decreased $1.9 billion.
- Consumer goods decreased $1.1 billion.
- Cell phones and other household goods decreased $1.1 billion.
Net balance of payments adjustments increased $0.1 billion.
Imports of services increased $0.5 billion to $61.3 billion in January.
- Travel increased $0.5 billion.
- Financial services increased $0.1 billion.
- Transport decreased $0.2 billion.
Real Goods in 2017 Dollars – Census Basis (exhibit 11)
The real goods deficit increased $2.5 billion, or 3.0 percent, to $86.0 billion in January, compared to a 3.1 percent increase in the nominal deficit.
- Real exports of goods decreased $0.4 billion, or 0.2 percent, to $145.0 billion, compared to a 0.1 percent increase in nominal exports.
- Real imports of goods increased $2.2 billion, or 1.0 percent, to $231.0 billion, compared to a 1.2 percent increase in nominal imports.
Revisions
Exports and imports of goods and services were revised for July through December 2023 to incorporate more comprehensive and updated quarterly and monthly data, which include a $1.0 billion correction to November 2023 exports of other goods to Canada. In addition to these revisions, seasonally adjusted data for all months of 2023 were revised so that the totals of the seasonally adjusted months equal the annual totals.
Revisions to December exports
- Exports of goods were revised up $0.4 billion.
- Exports of services were revised down $1.8 billion.
Revisions to December imports
- Imports of goods were revised down less than $0.1 billion.
- Imports of services were revised up $0.6 billion.
Goods by Selected Countries and Areas: Monthly – Census Basis (exhibit 19)
The January figures show surpluses, in billions of dollars, with South and Central America ($4.2), Netherlands ($4.1), Hong Kong ($2.2), Australia ($1.6), United Kingdom ($1.4), Belgium ($1.1), Singapore ($0.4), Brazil ($0.2), and Saudi Arabia ($0.2). Deficits were recorded, in billions of dollars, with China ($22.9), European Union ($18.1), Mexico ($12.7), Vietnam ($8.5), Japan ($7.3), Germany ($6.3), Ireland ($6.0), Canada ($5.7), South Korea ($5.5), Taiwan ($4.8), Italy ($3.8), India ($3.7), Malaysia ($2.1), Switzerland ($1.5), France ($1.4), and Israel ($0.4).
- The deficit with Japan increased $2.1 billion to $7.3 billion in January. Exports increased $0.1 billion to $6.2 billion and imports increased $2.2 billion to $13.5 billion.
- The deficit with Taiwan increased $1.4 billion to $4.8 billion in January. Exports decreased $0.2 billion to $3.3 billion and imports increased $1.2 billion to $8.1 billion.
- The deficit with Vietnam decreased $1.5 billion to $8.5 billion in January. Exports increased less than $0.1 billion to $0.9 billion and imports decreased $1.5 billion to $9.4 billion.
Goods and Services by Selected Countries and Areas: Quarterly – Balance of Payments Basis (exhibit 20)
Statistics on trade in goods and services by country and area are only available quarterly, with a one-month lag. With this release, fourth-quarter figures are now available.
The fourth-quarter figures show surpluses, in billions of dollars, with South and Central America ($21.3), Netherlands ($14.5), Singapore ($8.5), Australia ($8.3), Hong Kong ($5.9), Brazil ($5.0), United Kingdom ($4.0), Switzerland ($1.7), Saudi Arabia ($1.7), and Belgium ($1.7). Deficits were recorded, in billions of dollars, with China ($60.7), Mexico ($41.8), European Union ($30.7), Vietnam ($28.7), Germany ($20.8), Japan ($16.0), Canada ($14.7), India ($13.2), Taiwan ($12.5), Italy ($11.3), South Korea ($9.5), Malaysia ($5.5), France ($3.1), Israel ($1.5), and Ireland ($0.3).
- The deficit with Canada increased $4.5 billion to $14.7 billion in the fourth quarter. Exports increased $2.8 billion to $110.4 billion and imports increased $7.3 billion to $125.2 billion.
- The deficit with the European Union increased $2.7 billion to $30.7 billion in the fourth quarter. Exports decreased $3.5 billion to $159.0 billion and imports decreased $0.8 billion to $189.7 billion.
- The deficit with Ireland decreased $3.2 billion to $0.3 billion in the fourth quarter. Exports increased $0.5 billion to $25.7 billion and imports decreased $2.7 billion to $26.0 billion.
All statistics referenced are seasonally adjusted; statistics are on a balance of payments basis unless otherwise specified. Additional statistics, including not seasonally adjusted statistics and details for goods on a Census basis, are available in exhibits 1-20b of this release.