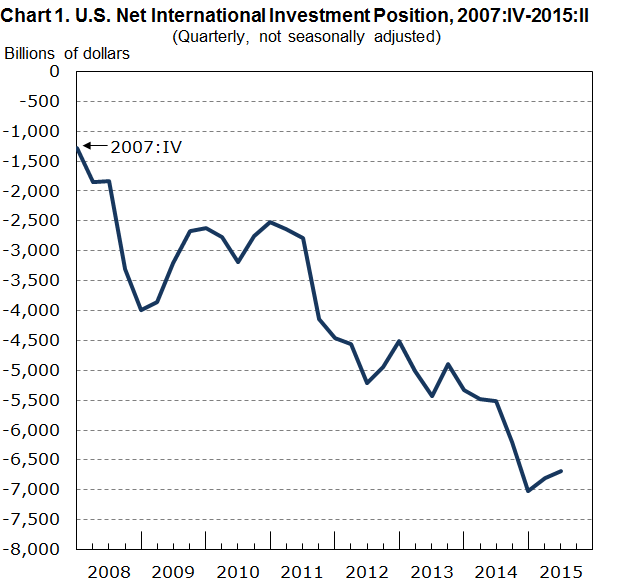
The U.S. net international investment position at the end of the second quarter of 2015 was -$6,688.3 billion (preliminary) as the value of U.S. liabilities exceeded the value of U.S. assets (chart 1, table 1). At the end of the first quarter, the net investment position was -$6,801.4 billion (revised).
Highlights
The $113.1 billion increase in the net investment position reflected net other changes in position of $168.2 billion that were partly offset by net financial transactions of -$55.1 billion. Other changes in position include price changes, exchange-rate changes, and other changes in volume and valuation.
U.S. assets decreased $779.3 billion and U.S. liabilities decreased $892.4 billion, mostly as a result of decreases in the value of financial derivatives.
U.S. assets excluding financial derivatives increased $135.5 billion, reflecting financial transactions of $144.9 billion that were partly offset by other changes in position of -$9.4 billion.
U.S. liabilities excluding financial derivatives decreased $20.2 billion, reflecting other changes in position of -$221.9 billion that were mostly offset by financial transactions of $201.7 billion.
The increase in the net investment position reflected the impact of price decreases for U.S. assets and liabilities and the appreciation of foreign currencies against the U.S. dollar, as described in greater detail below. The net investment position increased 1.7 percent in the second quarter, compared with an increase of 3.1 percent in the first quarter and an average quarterly decrease of 7.3 percent from the first quarter of 2011 through the fourth quarter of 2014. The net investment position was equal to 3.2 percent of the value of all U.S. financial assets at the end of the second quarter, down from 3.3 percent at the end of the first quarter.1
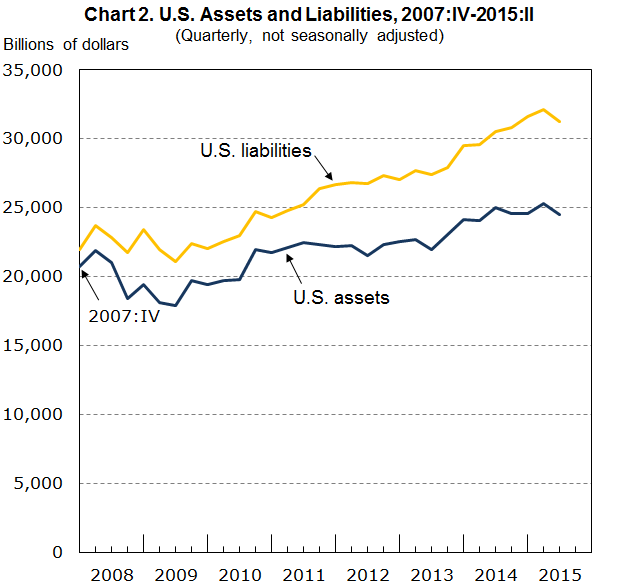
U.S. assets were $24,537.7 billion at the end of the second quarter compared with $25,317.0 billion at the end of the first quarter (chart 2). The $779.3 billion decrease reflected a $914.9 billion decrease in the value of financial derivatives that was partly offset by a $135.5 billion increase in the value of assets excluding financial derivatives.
U.S. assets excluding financial derivatives were $22,076.2 billion at the end of the second quarter compared with $21,940.7 billion at the end of the first quarter. The $135.5 billion increase reflected a $144.9 billion increase resulting from financial transactions that was partly offset by a $9.4 billion decrease resulting from other changes in position.2 Other changes in position reflected the decrease of foreign equity and bond prices that lowered the value of U.S. direct investment and portfolio investment assets. Decreases in foreign equity and bond prices were mostly offset by the appreciation of major foreign currencies against the U.S. dollar that raised the value of U.S. assets in dollar terms.3
U.S. liabilities were $31,226.0 billion at the end of the second quarter compared with $32,118.5 billion at the end of the first quarter (chart 2). The $892.4 billion decrease reflected an $872.2 billion decrease in the value of financial derivatives and a $20.2 billion decrease in the value of liabilities excluding financial derivatives.
U.S. liabilities excluding financial derivatives were $28,800.6 billion at the end of the second quarter compared with $28,820.8 billion at the end of the first quarter. The $20.2 billion decrease reflected a $221.9 billion decrease resulting from other changes in position that was mostly offset by a $201.7 billion increase resulting from financial transactions. Other changes in position were mostly attributable to decreases in U.S. bond prices that lowered the value of U.S. portfolio investment liabilities. These decreases were slightly offset by increases in the value of U.S. liabilities denominated in foreign currencies as the U.S. dollar weakened in the second quarter.
Revisions
The U.S. net international investment position at the end of the first quarter of 2015 was revised to -$6,801.4 billion from the previously-published value of -$6,794.0 billion. The $7.4 billion downward revision to the net position reflected a $7.3 billion downward revision to U.S. assets and a $0.1 billion upward revision to U.S. liabilities.
U.S. assets at the end of the first quarter were revised to $25,317.0 billion from $25,324.4 billion; U.S. liabilities were revised to $32,118.5 billion from $32,118.3 billion. These revisions reflect revised source data from the Treasury International Capital (TIC) reporting system and from BEA’s quarterly surveys of direct investment.
****
More International Trade
Mexico trade surplus soars as slowing demand damps imports
Mexico’s trade surplus was four times as large as economists had forecast in March as slowing demand damped imports.
NCBFAA elects new officers and board members for 2024-2026
The National Customs Brokers and Forwarders Association of America (NCBFAA), following its 51st Annual Conference in Fort Lauderdale, Florida, on April 14-17, finalized its election today of a new slate…