As Federal stimulus fades and supply constraints continue, U.S. shipment volumes declined by 4.2% compared to May, on a seasonally adjusted basis. That said, 2021 volumes pulled ahead of 2019 levels in May, and showed a positive comparison again in June.
As our expenditures index and implied rates series show, however, rates are not yet feeling relief.
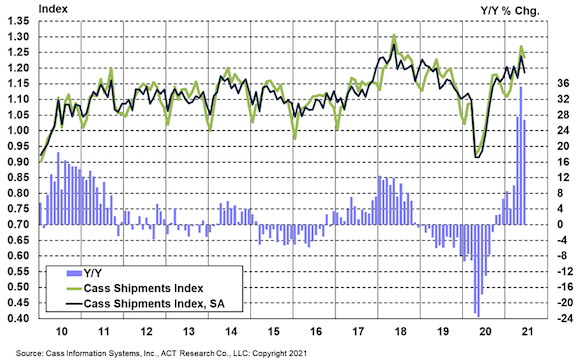
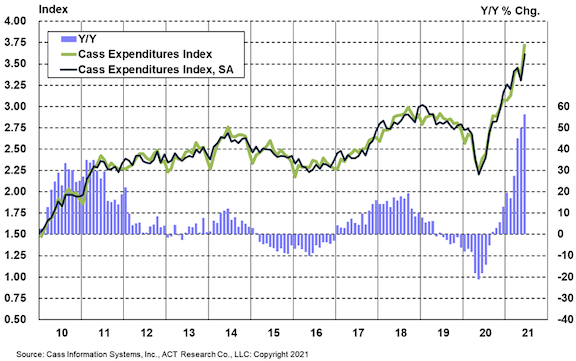
Cass Freight Index - Shipments
The shipments component of the Cass Freight Index grew 26.8% y/y in June, decelerated from the record 35.3% y/y increase in May. On a seasonally adjusted (SA) basis, the shipments index declined by 4.2% m/m in June, after a 5.9% m/m surge in May.
While still among the top ten results in the past decade, the result indicates a little slower volume environment than May, which is consistent with several other broad freight measures, including rail volumes and spot truckloads. Fading Federal stimulus was likely a contributor, but our industry discussions suggest shipment volumes continue to be hindered by supply constraints, which range from driver and trailer shortages in TL and LTL to chassis shortages hampering intermodal capacity.
The Cass shipments index remained positive on a two-year stacked basis for the second straight month, 4.2% above June 2019, after a 3.3% year-over-two-year increase in May.
Cass Freight Index - Expenditures
The expenditures portion of the Cass Freight Index grew at its fastest pace ever on a y/y basis again in June, up 56.4% y/y, accelerated from 49.9% y/y growth in May. This acceleration occurred even against a slightly tougher comparison, as higher rate trends outweighed the slower shipment volumes.
Tougher comparisons in the coming months will naturally slow these y/y increases, but extraordinary growth rates will continue in the near term, driven by increases in both shipment volumes and freight rates.
On a seasonally adjusted basis, the Cass expenditures index rose 9.4% from May, and with volumes softer m/m, the decline was more than explained by higher embedded rates, which jumped 12.3% m/m.
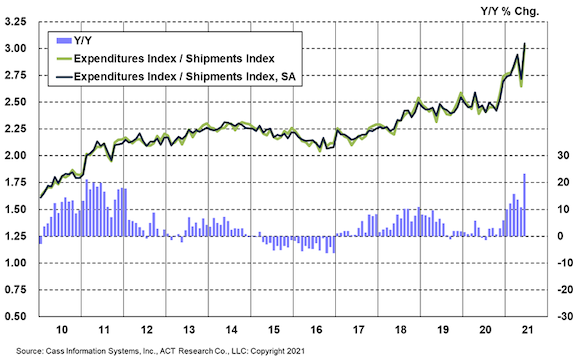
Freight Rates
A simple calculation of the Cass Freight Index data (expenditures divided by shipments) produces a data set of “implied freight rates” that explains the overall movement in rates.
This result confirms that the accelerating trend remained intact through Q2, but the volatility in May and June was partly due to modal mix. The proportion of smaller/lower-cost LTL shipments in the data set rose in May, then returned to a more normal level in June, and this mix shift pressed total embedded rates higher in June just as it pressed the series lower in May (the “wash out” noted as likely in last month’s report).
- The freight rates embedded in the two components of the Cass Freight Index surged to a 23.4% y/y increase in June from a 10.8% y/y increase in May.
- The embedded rates jumped 12.3% m/m on a seasonally adjusted basis in June, more than reversing a 7.8% m/m decrease in May.
Outside of mix shifts impacting the m/m data patterns, this data series shows broad and material increases in freight rates across modes. This data series is diversified among all modes, with truckload representing more than half of the dollars, followed by rail, LTL, parcel, and so on.
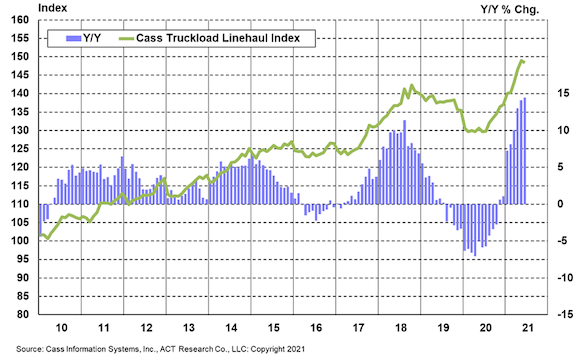
Truckload Linehaul Index
The Cass Truckload Linehaul Index® value of 148.4 in June fell slightly from 149.0 in May and accelerated to a 14.5% y/y increase from 14.1% in May. On a m/m basis, the seasonally adjusted index was 0.4% lower than May, after eleven straight increases.
A longer average length of haul appears responsible for the decline from May, rather than any softness in rate trends, as rates tend to fall on a per mile basis as mileage lengthens. Interestingly, this downtick is more symptomatic of the rail network stretched to capacity, which is resulting in more transloading of import shipments from the west coast to the Midwest via truck than normal.
The trend of the Cass Truckload Linehaul Index® should continue to move higher in the near-term, driven by robust demand and tight supply. But although truck, trailer and chassis production are still limited by parts shortages, capacity is beginning to accelerate as drivers respond to higher pay and parts constraints begin to ease, which will change the trajectory of truckload rates.
The ACT Freight Forecast now forecasts the Cass Truckload Linehaul Index® through 2023.
Freight Expectations
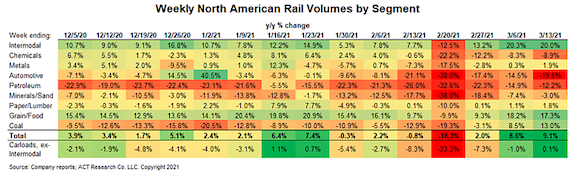
In June, Class I railroad trends slowed a bit more than tougher prior year comparisons, due in part to chassis shortages. But although automotive volumes turned negative y/y in recent weeks, they rose another 4% m/m in June after gaining 4% in May as parts shortages eased, beginning to recover from the 20% m/m decline in April.
In Q2, rail volumes were slightly above sequential seasonal patterns, up 23% y/y, but momentum slowed in recent weeks. Against a y/y decline of 6% in Q3’20, prior year comparisons will be more meaningful in the coming months, and this broad measure of freight volumes is still on pace for high-single-digit y/y growth in Q3.