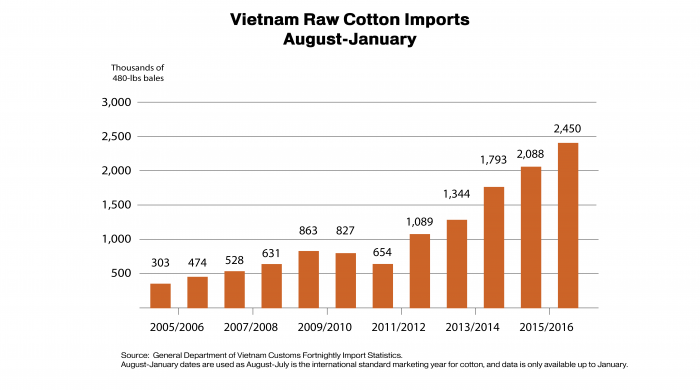
Vietnam’s demand for raw cotton has risen steadily for six years, with August-to-January (Marketing YTD) imports at their highest levels ever. This is a particularly positive sign for U.S. cotton exports, as American cotton has made up about 40 percent of Vietnam’s cotton imports over the last three years. U.S. exports of cotton have made up about 50 percent of Vietnam’s imports year to date, suggesting even greater market share than in the past.
Much of Vietnam’s growth in recent years has been driven by declines in cotton spinning in China. China’s now-ended cotton price support program required that the state reserve purchase large amounts of cotton, which drove up cotton prices in China relative to global levels. As a result of this uncompetitive pricing, a wave of Foreign Direct Investment flowed into Vietnam’s spinning sector. With the implementation of the ASEAN-China Free Trade Agreement, Vietnam-produced cotton yarn has duty free access to China, versus a 40 percent above-quota duty on raw cotton imported into China. Many Chinese-owned mills relocated to Vietnam from China, spinning the same yarn using the same (mostly U.S.) cotton, then shipping the yarn to China for the next stage in the value chain. About half to two-thirds of Vietnam’s cotton imports are spun in foreign-owned mills, with much of it exported to China.
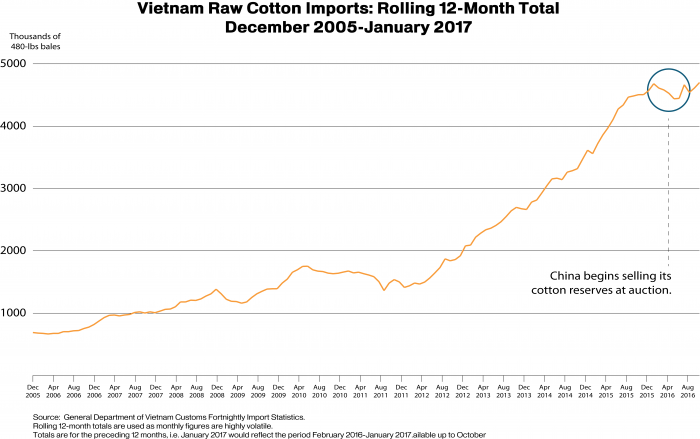
However, the very situation that gave Vietnam its startlingly fast growth threatened to take it away earlier this year and, with that lost cotton spinning, so too would be lost U.S. exports to Vietnam. As China sold its reserves at auction earlier this year, local prices in China moved closer to global levels, which stimulated some recovery in China’s domestic spinning industry. Likewise, generous governmental support for yarn spinning in western China also helped increase China’s demand for raw cotton. The result of this was straightforward: those countries that had previously benefited from China’s high internal prices began to struggle.
The highlighted period in the graph above illustrates the decline described. China’s cotton prices fell, and thus spinning activity in competitors like Vietnam sank in tandem. Many market observers believed this trend would continue and that Vietnam would lose a much larger share of the gains it had made in spinning activity. Given the United States’ pre-eminent position in the Vietnamese cotton sector, any decline in Vietnam’s spinning would likely prove injurious to U.S. exports. This would be particularly frustrating as the U.S. 2016/2017 crop is large, and stocks have been building. Additionally, when U.S. exporters were shut out of China by its initial policy moves, they were mostly able to shift to other markets, especially Vietnam, as spinning moved. But if demand in Vietnam dried up as a result of reserve auction sales in China, there would be no new spinning transferred to markets where U.S. cotton could compete for business. U.S. exports would have been replaced by releases from China’s state reserves.
However, the scenario described has not occurred. Vietnam’s cotton imports have turned upwards in recent months and, as shown in the first figure, are at record levels for August to November. This raises the question of why Vietnam’s spinning has recovered.
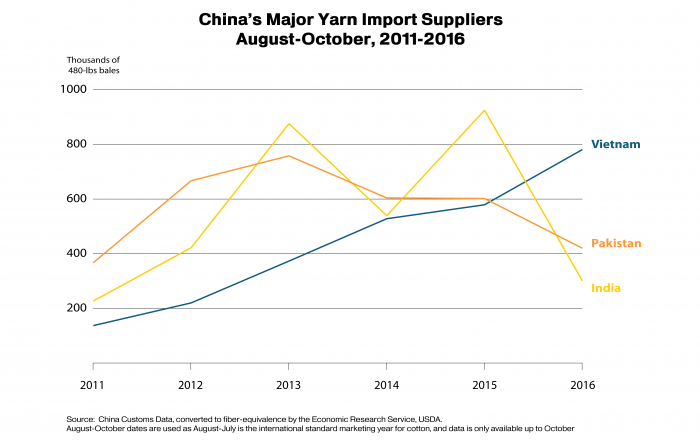
The chart below presents the cotton content of China’s yarn imports, that is, the amount of cotton bales represented by the yarn China imports, for the August to October period from 2011 to 2016 for China’s three major yarn suppliers: India, Pakistan, and Vietnam. As the graph makes quite apparent, Vietnam’s growth has been the most extraordinary of the three countries over the period, going from third to first. Perhaps most interestingly of all, however, is Vietnam’s striking increase in yarn shipped to China in 2016, even as Pakistan and India show declines (in India’s case a fairly severe decline).
Vietnam’s strength relative to India and Pakistan may have several sources. Both India and Pakistan have faced crop shortfalls and tighter stocks in the last year, which led to comparatively high internal prices even as China’s domestic prices were becoming more competitive.
Another key factor driving Vietnam’s relative strength may be the China-ASEAN Free Trade Agreement, which began to come into effect in 2010. With full implementation of provisions related to cotton and yarn implemented fairly rapidly, China’s customs duty on yarn imported from Vietnam, or from any ASEAN country, is zero. Notably, some other ASEAN countries such as Indonesia also saw yarn exports to China rise, while yarn exports from major non-ASEAN countries such as Uzbekistan and South Korea experienced declines.
If duty-free access for yarn is driving increased spinning in Vietnam, then the China-ASEAN Free Trade Agreement could be pushing U.S. cotton exports higher. Yarn spinning being shifted from producer-countries like India, Pakistan, Uzbekistan, and to some extent China, into duty-preferred importer countries like Vietnam bodes well for U.S. exports. Because the China-ASEAN Free Trade Agreement does not require that raw cotton inputs be sourced within the area, U.S. exporters are able to derive an indirect benefit from China’s duty-free ASEAN access.
More International Trade
Mexico trade surplus soars as slowing demand damps imports
Mexico’s trade surplus was four times as large as economists had forecast in March as slowing demand damped imports.
NCBFAA elects new officers and board members for 2024-2026
The National Customs Brokers and Forwarders Association of America (NCBFAA), following its 51st Annual Conference in Fort Lauderdale, Florida, on April 14-17, finalized its election today of a new slate…