For the past two years the Port of Boston has posted some solid numbers based on improved port efficiencies.
In FY 2014, the Port of Boston posted 204,951 teus at Massport’s Conley Terminal in South Boston, up over 6% from the previous year with 84% of the total being full loads.
Nearly all East Coast ports benefited from the disruptions on the West Coast but Michael Vanderbeek, Deputy Port Director at Massport, says the numbers reflect both “organic growth as well as [diversions] from the West Coast.”
This is a strong performance for a port bracketed by larger competitors like the Port of Montreal to the north, Halifax to the northeast, and the East Coast’s mega-hub the Port of New York/New Jersey to the south. Add in competition from other Atlantic coast ports like Wilmington DE, Philadelphia PA, Norfolk VA, a host of smaller ports in the northeast like Saint John NB, Portland ME, Portsmouth NH, the Rhode Island ports of Providence and Davisville, the three Connecticut ports and even the Port of Albany, and it is easy to appreciate the “position” of the Port of Boston.
For most of the past thirty years the Port of Boston has been working to retain their market share in New England from port poachers near and far. This has been a difficult task and the giant hub of Port of NY/NJ naturally pulls massive amounts of freight into its orbit with its multitude of terminals, carriers, calls, customers and options. Montreal has also proved to be a formidable draw along with Halifax on New England freight.
But the regional port dynamics may be changing as a closer look at the figures reveals new trends.
Hubanomics: New England Market
The New England market of 14 million plus consumers roughly encompasses from Maine to Connecticut and over to Albany in northern New York state. The Connecticut market is really divided around the middle of the state along the Connecticut River with the eastern half being a “New England” market and the western side part of greater New York, or as it is often explained, the line of demarcation between Red Sox versus Yankees rooting interests.
Boston, often called the “Hub,” is the economic powerhouse of the region. The relatively high-income levels for the local area are a result of a large pool of white-collar jobs in technology, healthcare, pharmaceuticals, finance, insurance and education.
For years high value imports to serve the demographics poured in principally through the Port of Boston and the Port of New York/New Jersey. Most of the latter being serviced by truck on the heavily trafficked I-95. Over the years, other services have come and gone, including container feeder ship services between Boston, usually Portland, Maine, and Halifax, Nova Scotia, sometimes with connections to the Port of NY/NJ. Also in the past there have been a number of container barge services from Boston via Cape Cod.
Over the years, New England’s export freight was generally heavy, low value cargo like waste paper and scrap metal. These cargoes, in terms of filling ocean containers, weigh out before they cube out. This combination of high value consumer imports and heavy low value exports led to a large imbalance of imports to exports in terms of both teus and dollar value.
A Hub that Spoke: Inside the Numbers
Just as there are “analytics” in baseball (a concept big with the Red Sox) so are there numbers within the numbers in the port business that illustrate trends often missed with cursory views of teus.
It perhaps begins with what the “port is not.” The Port of Boston [Conley Terminal] is not an intermodal beachhead for freight moving to (or from) the North American hinterland. Indeed, there are intermodal terminal connections located some 50 miles away in the Worcester/Palmer area of Massachusetts. But the railhead connections do not frame the purpose of ocean carrier calls to Boston. As Vanderbeek says at every opportunity, “The port strategy isn’t major intermodal but is to serve the New England market well.”
The recent numbers bear out Vanderbeek’s assessment of “well”. To begin, FY 2014 tally of over 172,000 loaded containers was up 8% from FY 2013. By way of comparison, in FY 2009 the port broke 200,000 teus, but registered nearly 41,000 teus in empties.
A further look at the numbers shows a surprising trend. In FY 2014, approximately 1 container was exported for every 1.5 import containers. This represents a dramatic turn around from the past when the Port posted 3 or even 4 import containers for every exported container. According to recently released numbers (March 2014 - Feb 2015 compared to March 2013 - Feb 2014) export containers are up 9.3% both in number and in metric tons. Imports on the other hand are up 8.8%.
More importantly, these numbers do not include over the road truck movements (New York/New Jersey) that in the past could inflate traffic figures for the Port.
But this import/export ratio didn’t change in a vacuum. The reasons behind the improvement are simple – the Port’s efficiency attracted freight and ship calls.
Port Progress
The Port of Boston has been weighed down with the stigma of being expensive and inefficient. Several years ago a number of initiatives and projects were undertaken to change the culture and indeed the perception of the port. Among these were new “work rules” with waterfront labor geared to productivity. The contract reduced premium hours and inaugurated a system of incentives based on container lifts – these lifts were tied to a Massport benchmark that is now at 27.20. The results have been game changing. In the period of March 2013 - March 2014 lifts ranged from a March low of 24.17 to a Dec. average of 29.32 with four months over 28 lifts per hour. From March 2014 - February 2015 the lowest tally was 28.53, excepting the weather impacted February total of 27.62. In nine of the months, the lifts exceeded 29. As Vanderbeek explains, “these are monthly averages, many days the operations are way over 30 lifts per hour.”
Another element is truck turn around times. Massport established a baseline of 45 minutes for a truck turnaround. During most months the gates handle 7,000 to just under 9,000 “gate visits”. With the exception of the February storm period, in the March 2014 - February 2015 period, every month was under 34 minutes.
The short waits outside the gate enable truckers, as Vanderbeek points out, “to effectively be a much larger pool of operators.” Secondly, quick drays enable truckers to make enough hauls to make a living, as opposed to being stuck in a queue for countless hours. Also, the landside efficiencies make the port effectively larger than its footprint. It has been estimated that the port has around a 400,000 teu capacity, or roughly twice the current volume, but that only works with efficient landside movements.
One of the Port’s main projects is the construction of the Thomas J. Butler Freight Corridor and Memorial Park announced last summer. Last summer, Massport broke ground on the 3,100-foot freight corridor. The corridor will remove all Conley Terminal truck traffic from the residential areas on East First Street and part of Summer Street and will reroute the traffic through the former Coastal Oil site, the newly acquired MBTA parcels, the land currently owned by the Exelon Corporation, and connect it to the highway system.
Another major project is dredging. The $310 million Boston Harbor deepening project was included in the 2014 Water Resources Reform and Development Act (WRRDA). The project will deepen the North Entrance Channel from 45 feet to 51 feet, the main channel from 40 feet to 47 feet and all the Conley Terminal berths to 50’. Vanderbeek, told the AJOT, “The dredging project is on schedule,” which means completion in late 2018 or early 2019.
The Rise of the Medium-sized Port
Massport’s Conley Terminal is becoming the poster port for the medium sized port. For years the hub and spoke has dominated the thinking of port pundits worldwide. Bigger ships, fewer calls, larger volumes moving over a few high-density traffic corridors have been de rigueur.
But as the West Coast disruptions amply illustrated, what happens on the ships or inside the terminals is meaningless if congestion outside the terminal slows everything to a crawl. Further, if the last mile to the consumer is within fifty miles, why go many hundreds or even thousands of miles out of the way?
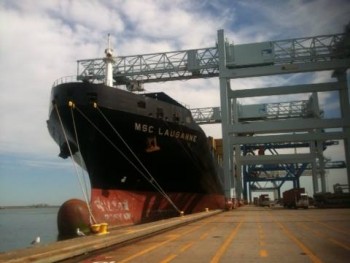
A holistic view of supply chain velocity shows medium-sized ports [albeit still post Panamax 8,000 teu ships] like Boston in a different light. MSC has a service schedule from Northern Europe to Boston [first inbound call] over to Philadelphia and down to their hub in Freeport. This new triangular trade pattern, offers importers the first call but gives exporters a chance at the North-South trade lane via Freeport hub.
It is these types of opportunities that could flourish with medium sized ports along the Atlantic coast in the future.