California’s merchandise export trade posted solid year-over-year gains in August.
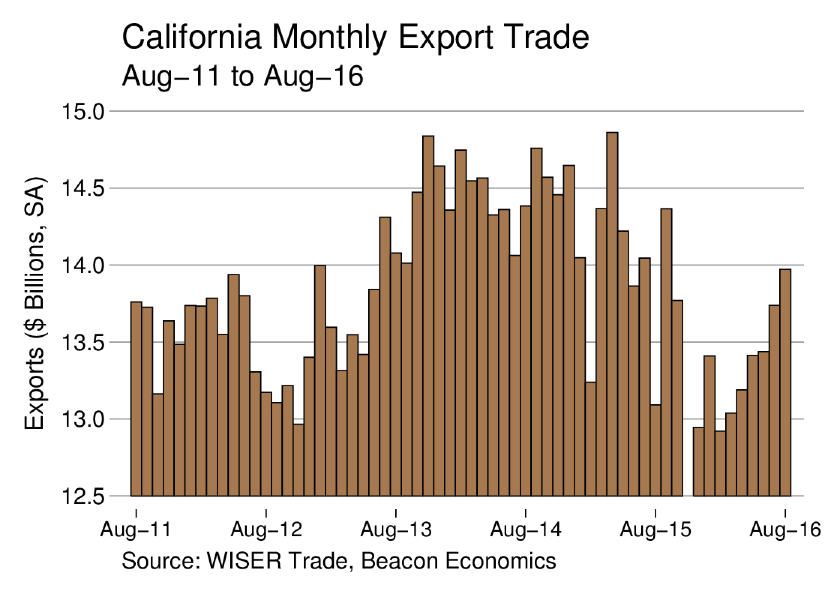
According to a Beacon Economics analysis of U.S. trade statistics released this morning by the U.S. Census Bureau, the nominal value of shipments by California businesses to foreign destinations totaled $14.12 billion for the month, 6.7% above the $13.24 billion recorded in same month last year.
The state’s exports of manufactured goods in August rose by 2.9%, to $8.91 billion from $8.66 billion one year earlier. Exports of non-manufactured goods (chiefly agricultural products and raw materials) also increased, rising by 2.5%, to $1.52 billion from $1.48 billion the previous August. Re-exports, meanwhile, jumped by 19.3%, to $3.69 billion from $3.09 billion.
By way of comparison, the nominal value of overall U.S. merchandise exports in August slipped by 0.2%, while exports from Texas fell 5.7%.
“We’ve been seeing signs that the tide has been turning since the first quarter of the year, signs you might miss if only looking at year-over-year figures,” said Christopher Thornberg, Founding Partner of Beacon Economics. “The current month certainly represents a milestone in that we are seeing positive nominal gains over the year, but it is more important because it is a continuation of positive trends. Still, we do have a ways to go.”
Even with August’s gains, California’s $106.30 billion merchandise export trade so far this year continued to lag 2015’s year-to-date $110.85 billion total by 4.1%.
“We saw strong indications a few days ago that the August export figures released today would be up by a healthy margin,” said Jock O’Connell, Beacon Economics’ International Trade Advisor. “While the state’s major seaports do the heavy-lifting, virtually half of California’s merchandise export trade (by value) moves by air and both LAX and SFO had reported surges in outbound air cargo shipments.
California Imports
The U.S. Department of Commerce has determined that California was the state-of-destination for 18.7% of all U.S. merchandise imports in August, with a value of $36.34 billion, up 1.4 % from the $35.84 billion in imported goods in August 2015. Manufactured imports totaled $33.25 billion, an increase of 1.8% from $32.67 billion last year. Non-manufactured imports in August were valued at $3.09 billion, down 2.4% from $3.17 billion a year ago.
A Closer Look At The Numbers
As always, Beacon Economics cautions against reading too much into month-to-month fluctuations in state export statistics, especially when focusing on specific commodities or destinations. Significant variations June occur as the result of unusual developments or exceptional one-off trades and June not be indicative of underlying trends. For that reason, Beacon Economics compares the latest three months for which data are available (i.e., June-August) with the corresponding period one year earlier.
California's merchandise exports during the latest three-month period totaled $42.28 billion, a nominal gain of 0.3% from the $42.14 billion recorded during the same period last year.
On the plus side, exports of Computer & Electronic Products (computers and peripherals; communication, audio, and video equipment; navigational controls; and electro-medical instruments) increased by 3.1% to $11.12 billion from $10.78 billion. Exports of Miscellaneous Manufactured Commodities (a catchall category of merchandise ranging from medical equipment to sporting goods) saw a 4.0% increase to $4.28 from $4.11 billion. On the down side, the state’s exports of Transportation Equipment (automobiles, trucks, trains, boats, airplanes, and their parts) fell by 4.0% to $4.34 billion from $4.52 billion. Non-Electrical Machinery (machinery for industrial, agricultural and construction uses as well as ventilation, heating, and air conditioning equipment) exports dropped 7.8% to $3.71 billion from $4.03 billion.
Chemical exports (including pesticides and fertilizers; pharmaceutical products; paints and adhesives; soap and cleaning products; and raw plastics, resins, and rubber) edged lower by 0.8% to $3.36 billion from $3.39 billion.
Mexico continued to rank as California’s single largest export destination during the latest three-month period. However, the value of the state’s shipments south of the border slipped to $6.48 billion from $6.68 billion. Exports to Canada fell somewhat more, dropping 3.7 to $4.15 billion from $4.31 billion, while shipments to China were off by 5.6% to $3.69 billion from $3.91 billion. Exports to Japan strengthened, rising by 3.9% to $2.97 billion from $2.86 billion.
By contrast, California’s exports to the European Union rose by a healthy 8.0% to $7.67 billion from $7.10 billion, propelled largely by a 15.7% surge in the value of shipments to the United Kingdom, Brexit and the subsequent drop in the value of the pound notwithstanding.
The Outlook
Behind the nominal statistics, California’s export trade has been growing stronger through most of 2016. Whether that trend persists is open to discussion. There is an emerging consensus, fed in part by a glum forecast issued late last month by the Organization for Economic Cooperation and Development indicating that international trade will see, at best, modest growth over the next year, and by a more recent forecast of slower growth in the developed world issued by the IMP.
“The scariest prospect would be a Trump win in next month's presidential election, which could lead to debilitating trade wars if he makes good on his anti-trade rhetoric,” said Thornberg. “That would be bad news for all Californians.”
In the short run, the good news is that despite a generally gloomy picture abroad and a strong dollar, California exporters have been doing remarkably well.
More International Trade
Top cocoa grower seeks to avoid export defaults after price hike
Biden-Harris Administration announces preliminary terms with Micron to onshore leading-edge memory chip production in U.S.
• U.S. Department of Commerce proposes up to roughly $6.14 billion for Micron to expand domestic DRAM chip production in Idaho and New York • Micron’s full vision would create…
US sanctions Iran-linked ships, firms, people over drone program
The US sanctioned more than a dozen Iranian ships, people and companies linked to the country’s drone program, the latest in a push to punish Tehran over its April 13…