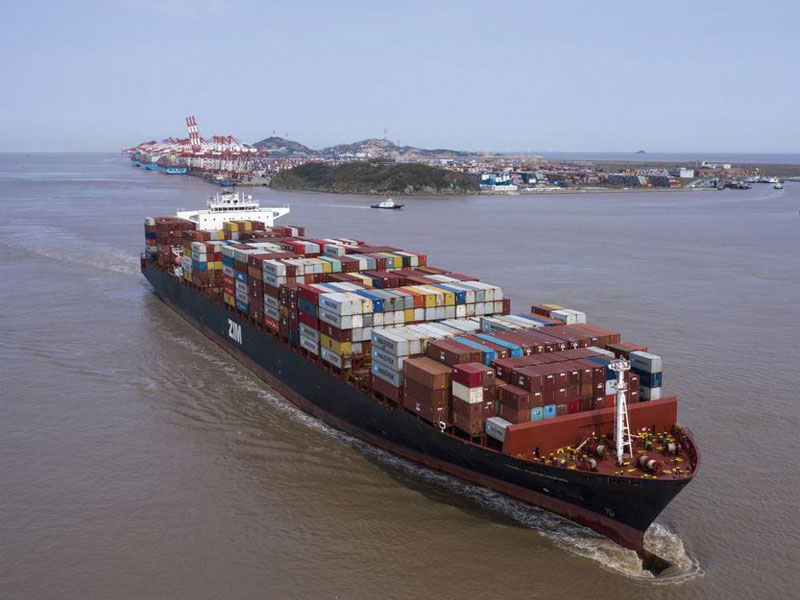
There have been very few years in which global container throughput – TEUs handled by containerports – has failed to grow…that is until the COVID-19 pandemic shutdown global economies. In 2020, it is estimated that containerports handled 801.48 million TEUs around 10 million TEUs less than in 2019 [based on UNCTAD/World Bank figures/BIMCO]. This was highly unusual as global container throughput has consistently risen for nearly three decades with only one other outlier.
Unsurprisingly, the last time this – a year of TEU decline – happened was during the Great Recession of 2009/10. During that period, TEUs in 2008 were at 516.15 million and plunged in 2009 to 472.18 million TEUs before recovering to 543.97 million TEUs in 2010. The almost 44 million drop in TEUs was followed by an unprecedented rebound of nearly 72 million TEUs.
The plunge and recovery from the Great Recession was dizzying, which brings us to the Great Rebound containerports are experiencing at the moment.
Going into 2018, the world’s containerports posted a throughput total of 795.74 million TEUs. In 2019, with the pandemic starting to hit its stride, world ports continued to grow tallying an estimated 811.22 million TEUs. It wasn’t until 2020, that the impacts of the pandemic and shutdowns began to show. Blank sailings – a wonderfully elegant euphemism for an unscheduled, unilateral cancellation of a container ship’s port call or elimination of an entire route – became de rigueur as slot capacity cutbacks tried to match the economic realities of the pandemic.
It’s also worth noting that in 2020, besides the pandemic, the hurricane season in the US also had a detrimental impact on the North American supply chain [particularly in dollar figures on imports which were off as much as 33% according to the U.S. Congressional figures].
Still, the impact of the pandemic on global TEU volumes in 2020 was much less than originally forecast. For example, BIMCO reported that container volumes in the first half of 2020 were down 6.8% – in line with the dire forecasts for a disastrous full year total.
But in a surprising turnabout, the pace of global trade picked up in the second half of 2020, first as a trot and then turning into a full blown gallop. And when the dust had settled, remarkably TEU volumes were off only 1.2% (BIMCO figure). It was a decline – the first decline in over a decade – but the difference of where the numbers could have landed and where they actually did is astounding. The total for the year, if the second half rebound didn’t occur, could have sunk the 2020 annual total TEU throughput to approximately 756 million TEU rather than the estimated 801 million – a huge swing of 45 million TEUs (similar to adding another Port of Shanghai to the world port total). Put another way, the total for 2020 would have been similar to the 757 million TEU throughput in 2017. Instead, container throughput has bounced back in unexpected volumes and estimates for 2021 range from a conservative 827 million TEUs to a more robust forecast of 849.57 million TEUs. While neither projection for 2021 would match anything close to the 72 million TEU rebound of 2010 (48 million TEUs is the optimistic tally) nonetheless the projected volumes for 2021 represents a big bounce in global container throughput that will be hard to handle.
Inside The Big Bounce
Fun with numbers. While there are no comparable periods in containerization’s history for what has occurred during the COVID years, there were some early indicators of a TEU bounce-back in the making. The NRF (National Retail Federation) chart outlining retail imports, pegged them at 21.8 million TEUs for 2018, 21.6 million TEUs for 2019 – the beginning of the pandemic – and at the height, 22 million TEUs for 2020. In brief, basically three fairly flat years as opposed to a descent into the maelstrom that could have happened. This doesn’t mean that the retail sector wasn’t hit hard - in 2017 the sector posted 20.5 million import TEUs and in 2016 notched 19.1 million TEUs – basically since 2011 until the pandemic adding a million TEUs has been pretty routine. So, three flat years is unusual, but a far cry from what could have happened. One of the reasons for the surprising resilience was that while consumer habits did change and e-commerce took center stage, ocean-borne retail imports continued unabated. And now with the pandemic winding down, retail is likely to add at least a million TEUs to last year’s total. It’s worth looking back at the Great Recession when retail numbers went from the trough in 2009 of 13.2 million import TEUs to 15.4 million import TEUs in 2010, a 2.2 million TEU increase. Would it be that surprising to see a similar leap for 2021?
Of course, China is the answer to nearly all questions concerning global container flow. Back in 2019, China accounted for around 242 million TEUs (UNCTAD figures) and the U.S. ranked number #2 at 55.52 million TEUs – an incomprehensible gap of 186.48 million TEUs.
Put another way, Shanghai the world’s largest containerport (see AJOT’s 5 million TEU Club Chart) had a 2019 throughput of 43.3 million TEUs (43.5 million TEUs in 2020), roughly only 12 million TEUs less than the entire U.S. total.
This begs the question of whether Shanghai’s port total will eclipse that of the entire U.S. in the near future. [Although Ningbo-Zhoushan’s rapid rise to 28.72 million TEUs might beat both Shanghai and the U.S. in the not too distant future.]
The disparity between China and the rest of the world is even clearer when looking at the world ports with over 5 million TEUs. Mainland China has 10 ports that in 2020 handled 5 million TEUs or more out of a global total of 34 containerports in the 5 million club. The U.S. had three (the ports of NY/NJ and Los Angeles and Long Beach) while Spain had two (Algeciras and Valencia) as did India (Jawaharlal Nehru and Mundra).
All in all, Chinese ports annually handle 30%-34% of the global total with no signs of slowing down. Given these numbers, it isn’t surprising that with so much TEU port capacity on one side of the supply chain pushing TEUs outbound, the inward flow into the smaller side – i.e the U.S. West Coast ports - is subject to backup.
Bumps Along the Watery Road
If we took an ISS (International Space Station) view of containerports and shipping routes, the fragility of the containerized supply chain would be easily apparent. Chokepoints abound.
Take the case of the 20,000 TEU ship Ever Given, which was wedged across the Suez Canal for nearly a week in late March, thoroughly disrupting the global supply chain. The accident was described as a “worst case scenario” as 12%-13% of the world’s global trade transits the 120-mile long waterway – roughly 51 ships a day. And the cascading impact on the supply chain took months to unravel – and arguably is still being felt today with late deliveries.
At this writing, a COVID outbreak in the Southern Chinese Port of Yantian [part of the Shenzhen port cluster located north of Hong Kong on the Pearl River] has essentially taken the port offline – a port-terminal that handled 13.48 million TEUs in 2020. Potentially, the shutdown in Yantian could have far greater impact on the global supply chain than the Ever Given. The neighboring ports in the cluster like Nansha (which handled 11.9 million TEUs in 2020) and Dachan Bay (1.36 million TEUs in 2020) can take up some of the slack while the mega-ports of Guangzhou at 23.17 million TEUs and Hong Kong at 17.96 million TEUs can also absorb some of the traffic.
But the Yantian case, prompts another question, what would happen to the global supply chain if a port like Singapore at 36.87 million TEUs, Ningbo-Zhoushan at 28.72 million TEUs or the real mega-port Shanghai at 43.500 million TEUs be closed for any period of time – what would happen to the global supply chain?
Some writers have suggested that the Ever Given disruption to the supply chain [and by extension the current situation in Yantian] is just another example of “excessive globalization”. But while the vulnerabilities to the supply chain inevitably increase as the scale of global trade expands, containerports and containership shipping have proven remarkably resilient as this Great Rebound attests.


